How to read a rep max chart
A rep max chart shows how much of your one-rep max (1RM) you can lift for a given number of reps. Most people can do about 5 reps at 87% of their max, 8 reps at 80% and 10 reps at 75%.
Use it two ways. Go from a set you’ve done to your estimated max, or from your max to the weight you should use for a set of 5, 8 or 10. The chart below shows the NSCA’s figures next to the average of the seven formulas our one rep max calculator uses, so you can see how closely they agree. (New to the term? Here’s what a one-rep max is.)
Rep max chart: % of 1RM for 1 to 15 reps
| Reps | NSCA chart | Average of 7 formulas | Best for |
|---|---|---|---|
| 1 | 100% | 100.0% | Strength |
| 2 | 95% | 94.3% | Strength |
| 3 | 93% | 91.5% | Strength |
| 4 | 90% | 89.0% | Strength |
| 5 | 87% | 86.6% | Strength |
| 6 | 85% | 84.4% | Strength |
| 7 | 83% | 82.3% | Muscle growth |
| 8 | 80% | 80.2% | Muscle growth |
| 9 | 77% | 78.3% | Muscle growth |
| 10 | 75% | 76.4% | Muscle growth |
| 12 | 70% | 72.8% | Muscle growth |
| 15 | — | 67.8% | Endurance |
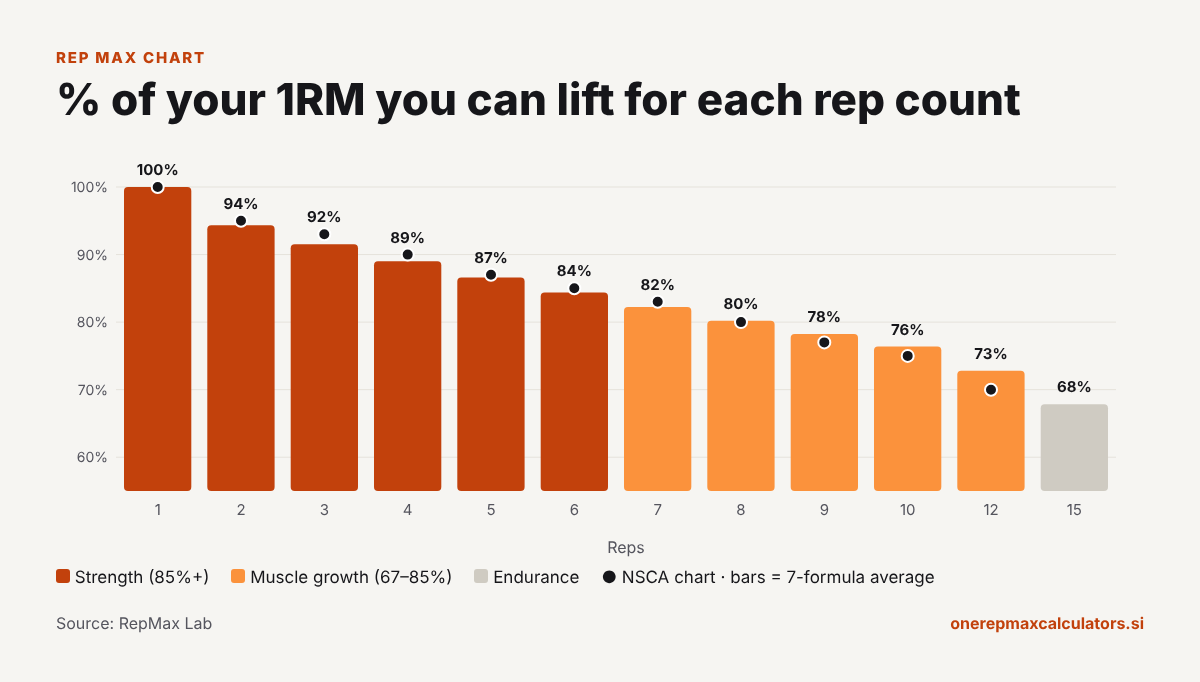
Up to 10 reps, the two columns never differ by more than about 1.5%. That’s reassuring: the reference chart coaches have used for years and the formulas behind most online calculators point to almost the same numbers.
How to read a rep max chart
Reddit threads about rep max charts are full of the same question: “What is this and how do I read it?” Fair enough. A grid of numbers isn’t self-explanatory. Here’s the whole process:
- Find the row for the weight you lifted.
- Move across to the column for the reps you completed. Count only clean reps, and only if you couldn’t have done another one.
- Read the number in that cell. That’s your estimated one-rep max.
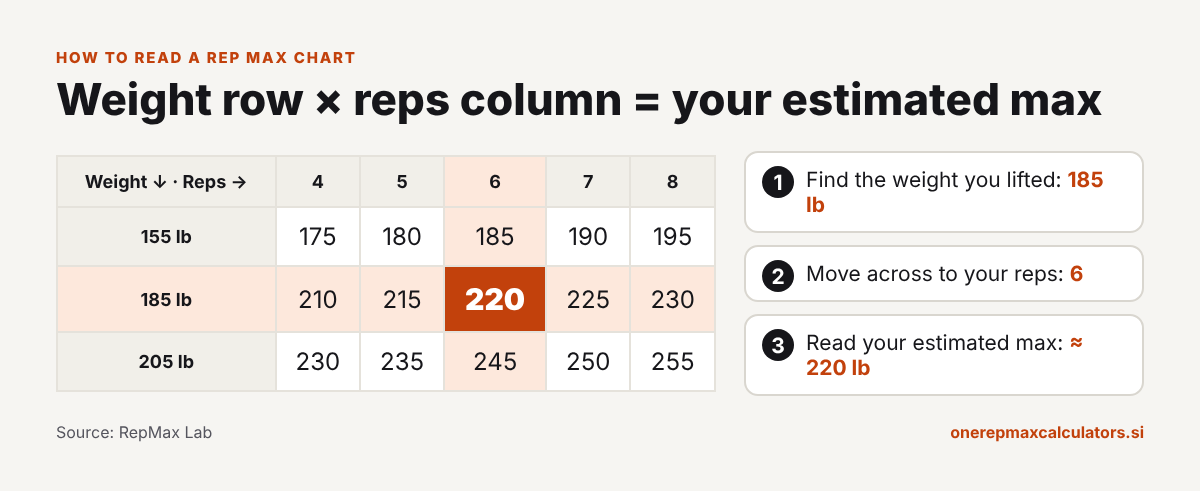
Example: you bench 185 lb for 6 reps. Find the 185 lb row in the pound chart below, go across to the 6-rep column, and you’ll see 220 lb. That’s your estimated bench max. You can check it in the calculator, which also shows the range across all seven formulas.
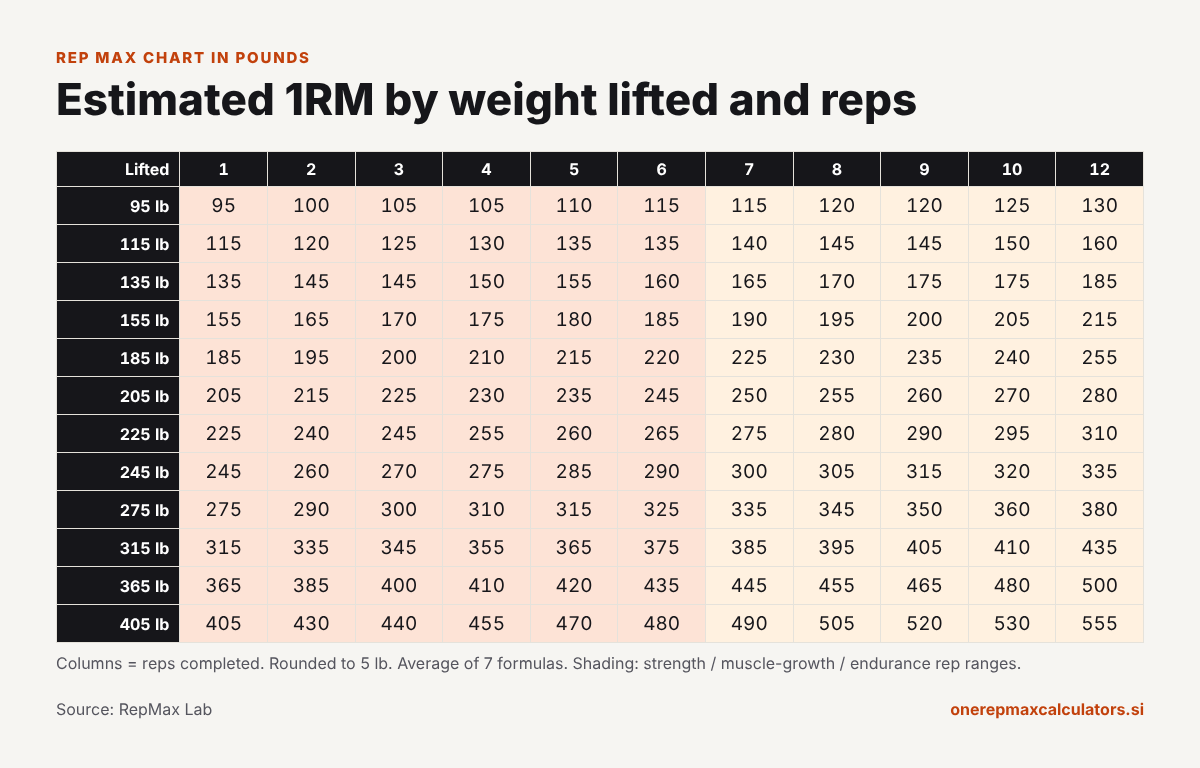
Rep max chart in pounds
Rows are the weight you lifted; columns are the reps you did. Each cell is your estimated 1RM, rounded to the nearest 5 lb.
| Weight lifted | 1 rep | 2 reps | 3 reps | 4 reps | 5 reps | 6 reps | 7 reps | 8 reps | 9 reps | 10 reps | 12 reps |
|---|---|---|---|---|---|---|---|---|---|---|---|
| 95 lb | 95 | 100 | 105 | 105 | 110 | 115 | 115 | 120 | 120 | 125 | 130 |
| 115 lb | 115 | 120 | 125 | 130 | 135 | 135 | 140 | 145 | 145 | 150 | 160 |
| 135 lb | 135 | 145 | 145 | 150 | 155 | 160 | 165 | 170 | 175 | 175 | 185 |
| 155 lb | 155 | 165 | 170 | 175 | 180 | 185 | 190 | 195 | 200 | 205 | 215 |
| 185 lb | 185 | 195 | 200 | 210 | 215 | 220 | 225 | 230 | 235 | 240 | 255 |
| 205 lb | 205 | 215 | 225 | 230 | 235 | 245 | 250 | 255 | 260 | 270 | 280 |
| 225 lb | 225 | 240 | 245 | 255 | 260 | 265 | 275 | 280 | 290 | 295 | 310 |
| 245 lb | 245 | 260 | 270 | 275 | 285 | 290 | 300 | 305 | 315 | 320 | 335 |
| 275 lb | 275 | 290 | 300 | 310 | 315 | 325 | 335 | 345 | 350 | 360 | 380 |
| 315 lb | 315 | 335 | 345 | 355 | 365 | 375 | 385 | 395 | 405 | 410 | 435 |
| 365 lb | 365 | 385 | 400 | 410 | 420 | 435 | 445 | 455 | 465 | 480 | 500 |
| 405 lb | 405 | 430 | 440 | 455 | 470 | 480 | 490 | 505 | 520 | 530 | 555 |
Rep max chart in kilograms
Same idea, rounded to the nearest 2.5 kg.
| Weight lifted | 1 rep | 2 reps | 3 reps | 4 reps | 5 reps | 6 reps | 7 reps | 8 reps | 9 reps | 10 reps | 12 reps |
|---|---|---|---|---|---|---|---|---|---|---|---|
| 40 kg | 40 | 42.5 | 42.5 | 45 | 45 | 47.5 | 47.5 | 50 | 50 | 52.5 | 55 |
| 50 kg | 50 | 52.5 | 55 | 55 | 57.5 | 60 | 60 | 62.5 | 65 | 65 | 67.5 |
| 60 kg | 60 | 62.5 | 65 | 67.5 | 70 | 70 | 72.5 | 75 | 77.5 | 77.5 | 82.5 |
| 70 kg | 70 | 75 | 77.5 | 77.5 | 80 | 82.5 | 85 | 87.5 | 90 | 92.5 | 95 |
| 80 kg | 80 | 85 | 87.5 | 90 | 92.5 | 95 | 97.5 | 100 | 102.5 | 105 | 110 |
| 90 kg | 90 | 95 | 97.5 | 100 | 105 | 107.5 | 110 | 112.5 | 115 | 117.5 | 122.5 |
| 100 kg | 100 | 105 | 110 | 112.5 | 115 | 117.5 | 122.5 | 125 | 127.5 | 130 | 137.5 |
| 110 kg | 110 | 117.5 | 120 | 122.5 | 127.5 | 130 | 132.5 | 137.5 | 140 | 145 | 150 |
| 120 kg | 120 | 127.5 | 130 | 135 | 137.5 | 142.5 | 145 | 150 | 152.5 | 157.5 | 165 |
| 140 kg | 140 | 147.5 | 152.5 | 157.5 | 162.5 | 165 | 170 | 175 | 180 | 182.5 | 192.5 |
| 160 kg | 160 | 170 | 175 | 180 | 185 | 190 | 195 | 200 | 205 | 210 | 220 |
| 180 kg | 180 | 190 | 197.5 | 202.5 | 207.5 | 212.5 | 220 | 225 | 230 | 235 | 247.5 |
Want it on paper or saved on your phone? Download the printable rep max chart (PDF), with pounds on one side and kilograms on the other.
How to convert one rep count to another
This is the use most charts ignore. Say your program or your home-gym app gives you 10 reps, but today you want heavier sets of 5. What weight should you use?
- Divide your weight by the percentage for the reps you did. 100 lb for 10 reps: 100 ÷ 0.75 = about 133 lb estimated max.
- Multiply by the percentage for the reps you want. 133 × 0.87 = about 115 lb for 5 reps.
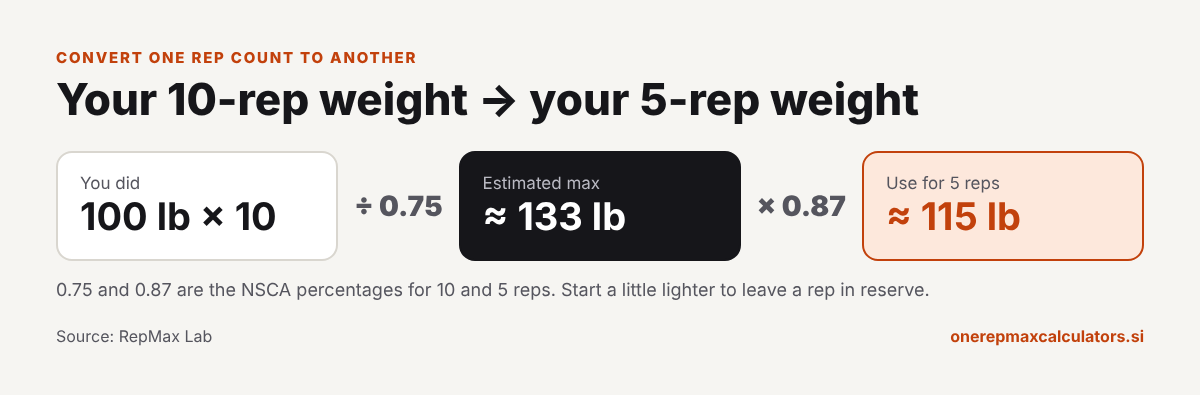
Start a little under that number. Rep max percentages describe all-out sets, and you’ll usually want to leave a rep or two in the tank.
Which formula is behind the chart?
Another fair Reddit question. Charts are built in one of two ways:
- From the NSCA Training Load Chart. A widely used reference table that pairs each rep count with a percentage of 1RM (NSCA Training Load Chart, PDF).
- From a prediction formula, such as Epley or Brzycki (1993). Different formulas agree closely at low reps and split apart at high reps. We compare the two most popular in Epley vs Brzycki.
The chart on this page shows both, and our pound and kilogram grids use the seven-formula average, so they match what our calculator tells you.
Using the chart to plan your training
Most programs are written as “sets × reps at a percentage”. The chart tells you whether that prescription is hard or easy. Three rough zones, based on NSCA guidelines:
- Strength: 85% and above, 6 reps or fewer per set.
- Muscle growth: about 67–85%, 6–12 reps.
- Muscular endurance: below about 67%, 12 reps or more.
For example, 5 sets of 5 at 80% of a 225 lb max is 180 lb. The chart says 80% is roughly an 8-rep max, so each set of 5 leaves about three reps in reserve. That’s hard work you can repeat, not five all-out sets. For every percentage from 50 to 100, see the percentage of 1RM chart.
Bench press and squat rep max charts
You don’t need a separate chart for each lift. The percentages are the same, and the formulas were mostly built on big barbell lifts. Two things do change. Bench press estimates tend to be the most reliable. Squat estimates depend on depth, so count only full-depth reps. For lift-specific numbers and charts, use the bench press max calculator or the squat max calculator. The deadlift is the odd one out; see the notes on the deadlift max calculator.
When the chart gets it wrong
Every rep max chart assumes your sets go to true failure and that you’re about as good at long sets as the average lifter. If you mostly train with high reps, you’ll beat the chart at 70% and fall short of it at 95%. If you’re a low-rep powerlifter, it’s the other way round. Research also suggests estimates are most accurate from sets of 10 reps or fewer (Reynolds et al., 2006). More detail in how accurate 1RM calculators are.
Frequently asked questions
How many reps can you do at 80% of your 1RM?
About 8. The NSCA chart puts 80% at 8 reps, and the formula average lands almost exactly there.
What rep max is 75% of 1RM?
Roughly a 10-rep max. If your max is 200 lb, 150 lb is about what you could lift for 10.
How do I turn a 3-rep max into a 1-rep max?
Divide by about 0.93 (NSCA) or 0.915 (formula average). 200 lb for 3 reps works out to about 215–220 lb
Is there a rep max chart in kg?
Yes. The kilogram chart above is rounded to 2.5 kg, and the printable PDF includes it.
Does the chart work for dumbbells and machines?
Roughly. It was built around barbell lifts, so treat dumbbell and machine numbers as a guide and give each exercise its own estimate.
Sources
- National Strength and Conditioning Association. Training Load Chart (PDF).
- Haff, G. G., & Triplett, N. T. (Eds.). (2016). Essentials of Strength Training and Conditioning (4th ed.). NSCA / Human Kinetics.
- Reynolds, J. M., Gordon, T. J., & Robergs, R. A. (2006). Prediction of one repetition maximum strength from multiple repetition maximum testing and anthropometry. Journal of Strength and Conditioning Research, 20(3), 584–592. PDF
- Brzycki, M. (1993). Strength testing: predicting a one-rep max from reps-to-fatigue. Journal of Physical Education, Recreation & Dance, 64(1), 88–90. Publication page